 Up to now, we have been looking mostly at db2top as a tool for observing the behavior of your system in real-time, but background mode and recording and playback has shown us that db2top can produce and examine historical data as well. The db2top tool can also be used to perform an analysis on such historical data and present a performance report. This ‘analysis’ feature is the topic of today’s post.
The db2top Analysis feature is invoked only from the command line. I touched upon it once before as one of the sub-options in my post on the -b command line option. It turns out that the analysis sub-option has many sub-options of its own.
You invoke the analysis option by specifying a -A sub-option with the -b (background) command line option. However, analysis can only be performed for a subset of the various background options. This subset is listed in the table below:
| Argument to -b | Performance report name |
|---|---|
| l | Sessions |
| t | Tablespaces |
| b | Bufferpools |
| T | Tables |
| D | SQL |
| s | Statements |
| U | Locks |
A ‘u’ for Utilities and an ‘F’ for Federated also do not result in an error message when used with the -A sub-option, but do not result in any reports.
There is also a sort order for each such report. This sort order is dependent upon the sort setting for the particular screen in db2top as you have it configured in your .db2toprc file. The easiest way to change the sort order is to:
- Go into db2top in interactive mode (db2top -d <database name>).
- Go to the screen for which you wish to perform analysis. For example, press the ‘l’ (lowercase ‘L’) key to go to the Sessions screen.
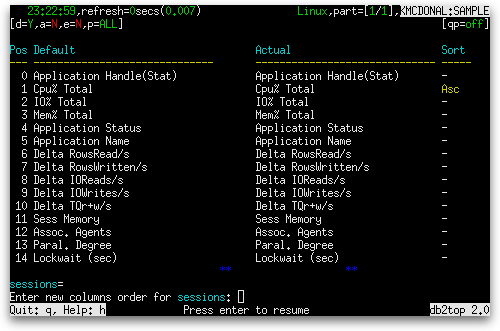
- Figure out the number of the column by which you wish to sort. The easiest way to do this is to go to the Change Columns Order screen by pressing the ‘c’ key. The column numbers are on the left.
- Remember the number of your column and exit the Change Columns Order screen by pressing the Enter key.
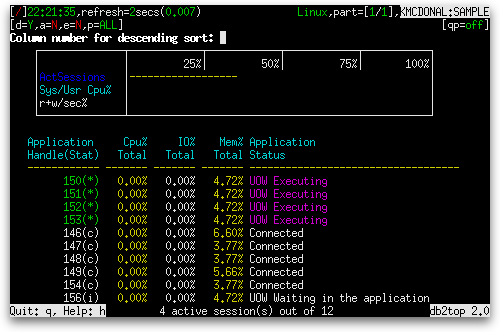
- Sort by the column of your choice by pressing the ‘z’ key (for descending) or the ‘Z’ key (for ascending) and, at the prompt, enter the number of the column you chose.
- Press the ‘w’ key to record your choice in the .db2toprc configuration file.
- Quit db2top interactive mode by pressing the ‘q’ key.
- The next time you run background mode with the analysis option, the sort order you recorded in the .db2toprc file will be used for the report.


The following video demonstrates the above steps using the Sessions Performance Report:
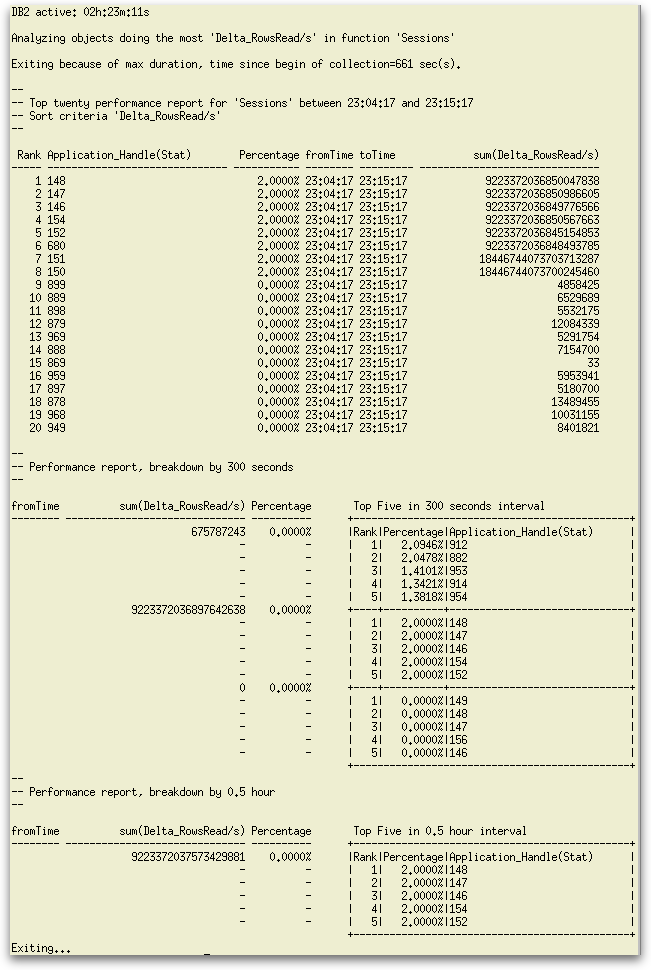
For columns that can have both a cumulative value and a delta value, the sort order is also influenced by whether the -k option has been specified. When you specify -k, db2top reports the cumulative value. Otherwise, the delta value of such columns is reported. Since these reports sum the values over the time period for which they are measured, the cumulative value is less appropriate and also leads to empty output in the “Performance report, breakdown by 300 seconds” and “Performance report, breakdown by 0.5 hour” reports.
The -m sub-option determines how many minutes of measurement go into the analysis report and the -s sub-option determines how many samples of measurement go into the analysis report.
Combining all these options together, we get the following output from a database named sample when we set Delta_RowsRead/s as the sort column for the Session screen in the .db2toprc file and then perform an 11-minute analysis with this command: db2top -d sample -b l -A -m 11

