When a monitoring or reporting tool reaches a certain level of sophistication, it needs to be able to report on itself as well. The db2top tool has a large number of configurable options, so it is fortunate that there is a screen that lets us see the present value of each such option. In today’s post, we will look at the Display Settings screen.
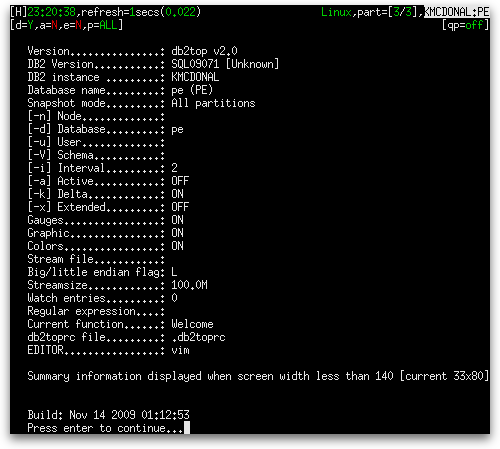
You launch the Display Settings screen by holding the Shift key and pressing the ‘O’ key. The Display Settings screen is designed to fit a screen that is at least 80 columns wide and 33 columns high, as shown below:

It reports much of the same information that is reported more tersely in the header of each of the main screens and it adds information about whether the platform is big or little endian, the stream file, the stream size, the number of watch entries, the value of the $EDITOR environment variable, and the build date of db2top itself. You must press the Enter key to return the screen you were viewing before you launched the Display settings screen.
When launched from screens that have tables that can be sorted, the Display Settings screen reports two more pieces of information: the sort column (and whether it is ascending or descending) and the interval for the sort. In these cases, the screen size more suited to fit such information is 35 rows or higher.

