I’m going to interrupt the two-part description of the db2top Memory screen I started last Friday because I need to address something that’s been bothering me about db2top. Having worked on the DB2 for LUW Workload Manager’s statistics functions, I am sensitive to seeing potential misuses of statistics. The Memory screen illustrates this problem perfectly.
As I mentioned Friday, there is a gauge on the Memory screen called Memory hwm% and computing it involves aggregating high watermarks. This is a problematic calculation and it is only one of many such calculations in the product.
In today’s post, I will go into why this calculation can produce a misleading number and how, despite its inaccurate label, you can still apply it effectively if you are aware of this limitation.
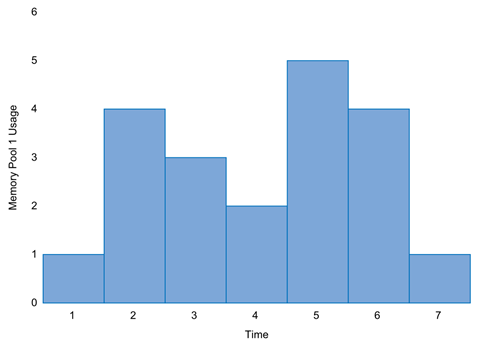
To explain the problem, let us look at two memory pools and graph how much memory is in use at several points in time for each pool.
Pool 1:
Pool 2:
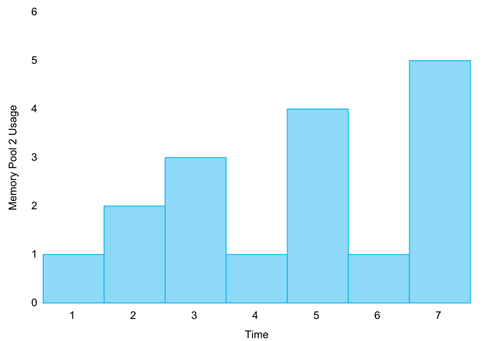
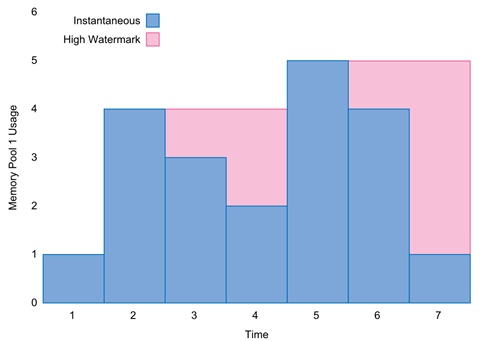
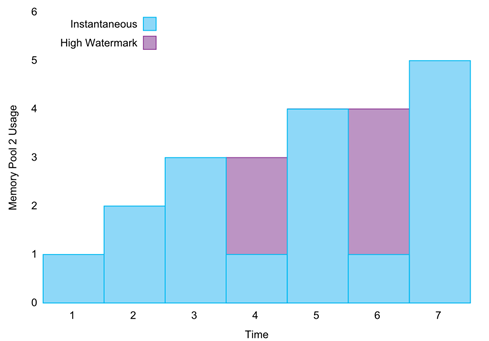
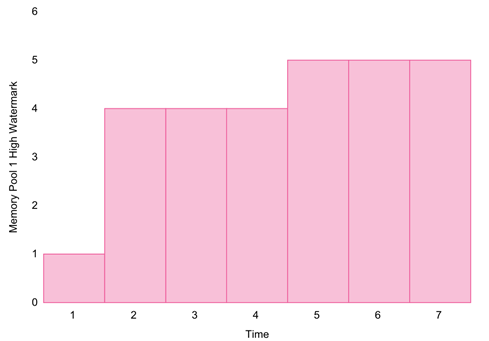
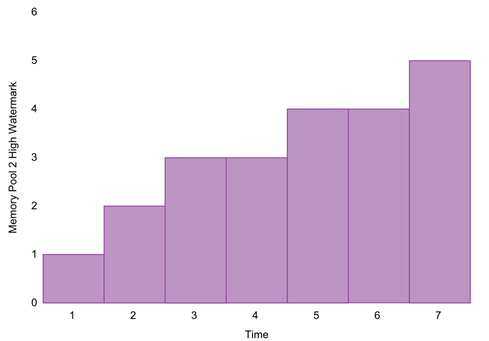
Both of the memory pools shown above acquire and release memory over time. Pool 1’s memory use peaks at time 5 and Pool 2’s memory use peaks at time 7. Let’s calculate high watermarks for each pool at each point in time and add them to each graph. It is simply a matter of making the height of each high watermark bar the same height as the highest point-in-time memory usage bar seen so far when moving left to right. In the following graphs, the high watermarks are inserted in behind the point-in-time measurements of actual memory use to illustrate the relationship between the two.
Pool 1:
Pool 2:
Now let’s take away the overlaid point-in-time usage data and reveal just the high watermarks.
Pool 1:
Pool 2:
Here’s where things go wrong. The db2top tool takes these two high watermarks and adds them together. As a graph, here is what db2top would be reporting at each point-in-time:
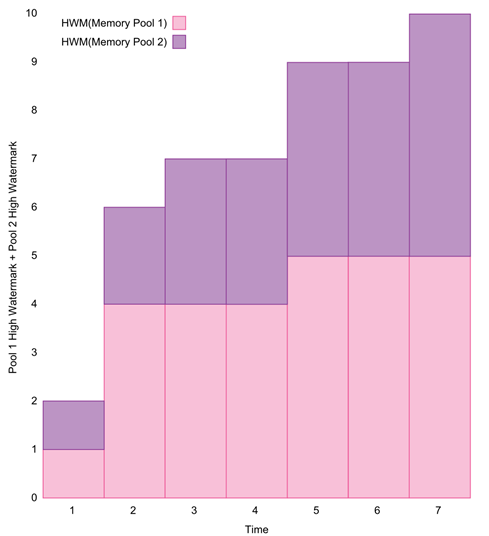
When you are expecting the high watermark of system memory usage as a whole, the sum of the individual high watermarks shown above will not always give you the right answer. Let’s examine the proper way to calculate the system memory usage high watermark by returning to the point-in-time data and summing them directly:
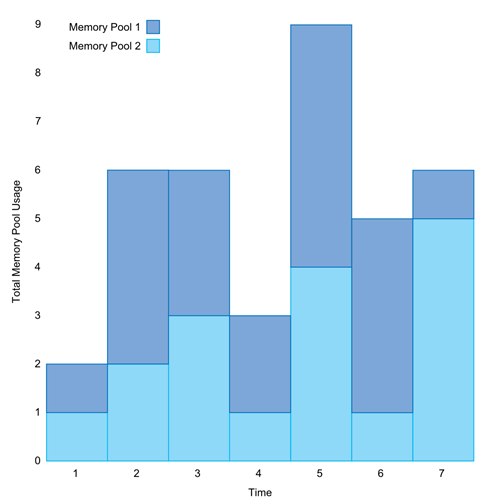
Now we simply calculate the high watermark at each point in time on the above graph. Again, we’ll show the high watermarks underneath the point-in-time data they are calculated from, so they only peek out when the point-in-time data drops below the high watermark:
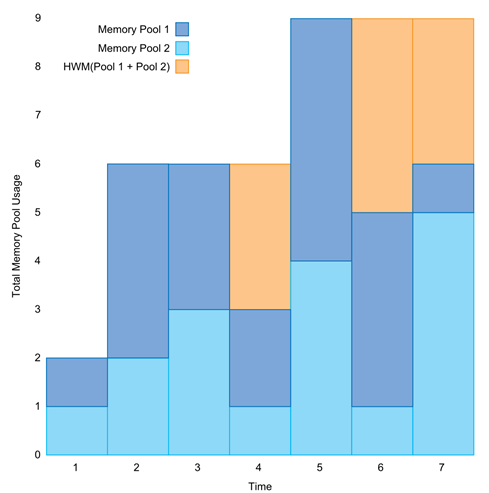
The high watermarks above are correct for the system as a whole. To see how they compare to the incorrect high watermarks, we’ll overlay the correct high watermarks over those produced by the calculation db2top performs:
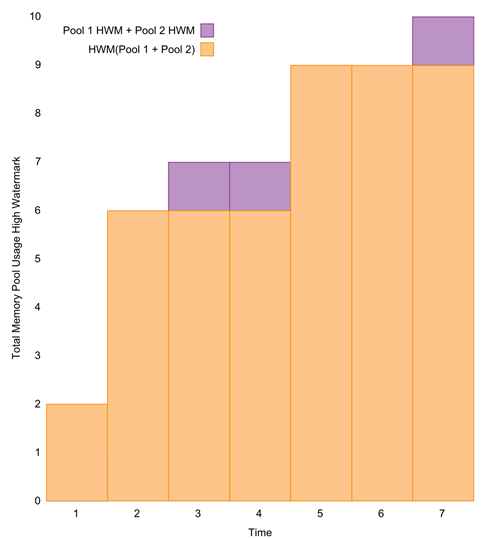
At times 3, 4, and 7, the db2top calculation gives you numbers that are higher than the actual system high watermark at those points in time. At no point does the db2top calculation produce a number that is below the correct high watermark. This is important. It means that the number db2top produces, while not strictly accurate, does give you an upper bound that you can rely on.
Let’s look at an example of how this could affect decision-making on a real system. To keep it simple, we concern ourselves with just two pools of memory: utility memory and application memory. Say you are deciding how much RAM to install on a system based on growth in the system-wide high watermark that you measure at the end of each day. Your particular system makes heavy use of utilities over night to load data into your database, causing the utility memory to spike to 16 GB, but during the day, the utility memory pool never uses more than a single gigabyte. Also during the day, application memory consumption peaks at 10 GB, but never goes above 2 GB at night. Summing the high watermarks of utility and application memory will give you 26 GB, perhaps suggesting a memory upgrade, while the actual peak is really 18 GB.
A problem you won’t see is db2top reporting that your peak memory usage is lower than it actually is, so if you go by what it says, you are more likely to over-configure than under-configure your system. Now that we’re aware of this limitation, we can make the most of the many high watermark stats that we saw last week on the db2top Memory screen and any others we encounter. Fortunately, most of the upcoming high watermark stats are taken directly from database-wide or instance-wide high watermarks generated by DB2 itself and do not involve db2top computing sums over them.

