In the first post about the Tables screen, we examined the data that is available on small screens between 80 and 140 columns wide. In today’s post, you will learn about the gauge and aggregates that appear for larger screens. On such screens, you will be able to see the balance of your workload between reads and writes and the balance of memory consumption between temporary and permanent tables.
You will also learn about another screen that can be launched directly from the Tables screen and shows top temporary storage consumers. You will see how much of the total each consumes and what applications and users are responsible for such memory consuming work.
The Larger Tables Screen
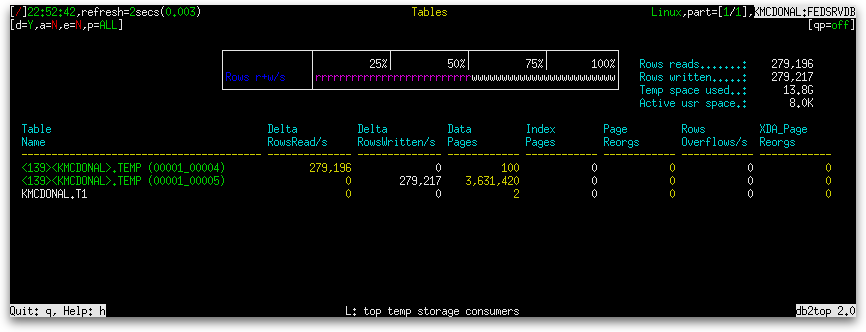
When the width of the Tables screen is increased to 141 columns or wider, two changes occur. A gauge is added above the table and a column of aggregates and their values is added to the right of the gauge, as shown below:

The gauge is as follows:
| Gauge Name | Gauge Type | Definition |
|---|---|---|
| Rows r+w/s | Normal |
|
The aggregates are as follows:
| Name | Definition |
|---|---|
| Rows reads |
|
| Rows written |
|
| Temp space used | The total size of all temporary tables taken together. It is expressed in some multiple of bytes, such as KB, MB, etc.
sum(tablespace_page_size × (data_object_pages + index_object_pages)) where sum() means summing across all temporary tables When tablespace_page_size cannot be determined for any table’s table space, 4096 is used. |
| Active usr space | The total size of all permanent tables taken together. It is expressed in some multiple of bytes, such as KB, MB, etc.
sum(tablespace_page_size × (data_object_pages + index_object_pages)) where sum() means summing across all permanent tables When tablespace_page_size cannot be determined for any table’s table space, 4096 is used. |
The Top Temp Storage Consumers Screen
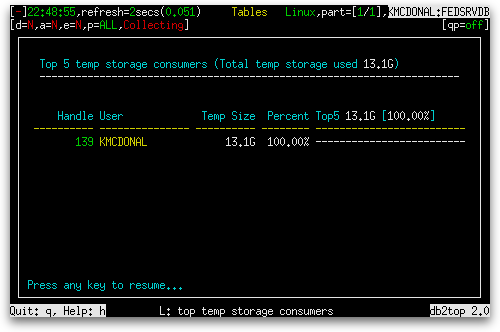
The footer on the Tables screen indicates that “top temp storage consumers” can be shown by holding the Shift key and pressing the ‘L’ key. This launches the “Top 5 temp storage consumers” dialog box on top of the Tables screen, as shown below:

| Column Name | Definition |
|---|---|
| Handle | The application handle of the application using the temporary table. |
| User | The database authorization ID of the user using the temporary table. |
| Temp Size | The size of the temporary table. It is expressed as a multiple of bytes (e.g. KB, MB, etc.).
tablespace_page_size × (data_object_pages + index_object_pages) |
| Percent | The percentage of the total memory consumed by all temporary tables consumed by this temporary table.
tablespace_page_size × (data_object_pages + index_object_pages) / sum(tablespace_page_size × (data_object_pages + index_object_pages)) × 100%, where sum() means summing across all temporary tables |
| Top5 x1 [y2%] | A bar of ‘-’ characters whose length represents the percentage of the total memory consumed by all temporary tables consumed by this temporary table.
tablespace_page_size × (data_object_pages + index_object_pages) / sum(tablespace_page_size × (data_object_pages + index_object_pages)) × 100%, where sum() means summing across all temporary tables |
1 The total amount of temporary table space consumed.
2 The percentage of the total amount of temporary table space consumed by the top 5 consumers.
If temporary tables are not being used at the time you launch the “Top 5 temp storage containers” dialog box, it simply contains the message, “No temporary storage in use” under the table heading.
The Tables screen is affected by pressing the ‘k’ key to switch between deltas and actuals, pressing the ‘i’ key to switch between showing only active tables and showing all tables, or pressing the ‘G’ key to switch between global and local snapshots. It is not affected by holding the Shift key and pressing the ‘X’ key to turn extended mode on and off.


