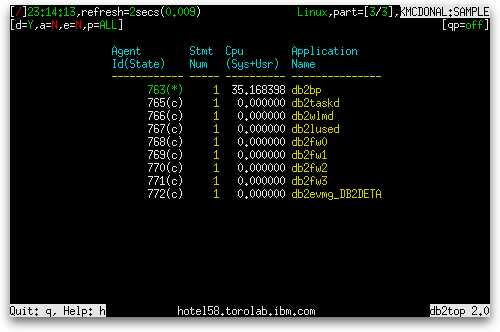
Today’s topic is the Statements screen. Unlike the Dynamic SQL screen, the Statements screen lets you see both dynamic and static statements and it groups them by the applications in which they run. As with the Agent screen, you can use this screen to see the operation that a statement is in the middle of, such as a fetch on a cursor and you can also see the name of that cursor. If the statement is static SQL, you can also see the section being executed.
This screen consists of the standard table and no gauges.
The data reported is affected by pressing the ‘G’ key to switch between global and local snapshots. It is also affected by pressing the ‘i’ key to switch between showing all objects and showing only active objects. It is not affected by pressing the ‘k’ key to switch between deltas and actuals and it is not affected by pressing the ‘X’ key to turn on and off extended mode.

The table lists statements and the applications executing them and contains the following columns (broken into two screens):
| Column Name | Definition |
|---|---|
| Agent Id(State) | A system-wide unique ID for the application (agent_id), together with a short code for the current status of the application (appl_status) in parentheses. Possible values for the status are:
“N/A” is shown (in bold) if there is no agent ID associated with the statement. Also shown in bold text if the state is “*”. |
| Stmt Num | A number to give a unique ID to the statement within the application. It is not dependent upon the order in which the statements were started. |
| Cpu (Sys+Usr) | The total CPU time in seconds used by the statement (stmt_usr_cpu_time + stmt_sys_cpu_time). |
| Application Name | The name of the application (appl_name) running at the client, as known to the database or DB2® Connect™ server. “Unknown” is shown if there is no agent ID associated with the statement. |
| Application Status | The current status of the application (appl_status). Possible values are:
If the status short code from the Agent Id(State) column is ‘*’, the color is magenta. If the status short code from the Agent Id(State) column is ‘l’, the color is red. |
| Statement Start | The time when the statement operation started executing (stmt_start). |
| Statement Stop | The time when the statement operation stopped executing (stmt_stop). |
| Statement Type | The type of statement processed (stmt_type). Possible values for the statement type are:
|
| Operation Type | The statement operation currently being processed (stmt_operation). Possible values for the statement operation are:
|
| Cursor Name | The name of the cursor corresponding to this SQL statement (cursor_name). |
| Rows Read | The number of rows read from tables for the statement (rows_read). |
| Rows Written | This is the number of rows changed (inserted, deleted or updated) in the table for the statement (rows_written). |
| Sect Nbr | The internal section number in the package for a static SQL statement (section_number). |
| Cost Estimate | Estimated cost per partition for the statement, as determined by the SQL compiler (query_cost_estimate). This value is reported in timerons. |
| Card Estimate | An estimate of the number of rows that will be returned per partition by a query (query_card_estimate). |
| DB User | The authorization ID of the user who invoked the application that is being monitored (auth_id). |


