In the previous post on the Sessions screen, we looked at the gauges and table columns that make up the default screen. In today’s post, we will examine all the extra information that becomes available on larger screens.
Such additional large-screen information includes several aggregates. You can use these aggregates to look across all sessions and answer many kinds of questions:
- How many sessions are local? How many are remote? How many of each are active versus idle?
- How much dynamic SQL is being submitted? How much static SQL?
- How active are the buffer pools across all sessions?
- How many reads and writes are not using a bufferpool?
- Is my sort heap high watermark exceeding my sort heap threshold?
- Is my sort heap so small that it is hurting my sorts and my hash joins?
- How many utilities are active at this time?
- How much inter-node traffic is there on my Data Partitioning Feature (DPF)-enabled system?
- Many more…
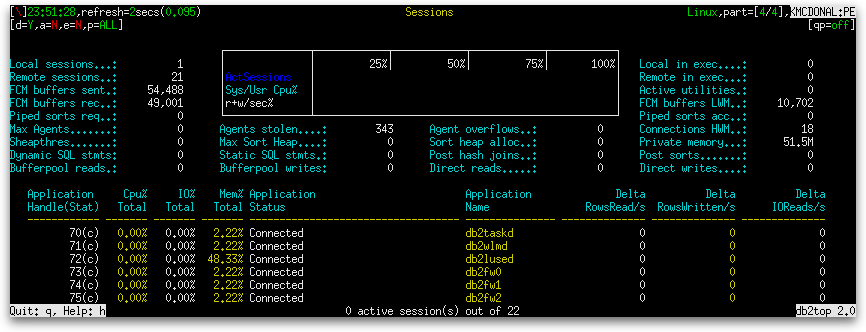
As was described in the first post about the Sessions screen, when the screen is 80 columns wide, a set of gauges is shown at the top and a table is shown below it. The screen continues to take this form as the width is increased to 140 columns. Beyond 140 columns, additional columns appear to the left, to the right, and below the set of gauges at the top, as shown below:

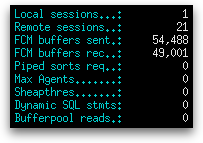
The column on the left consists of the following data aggregated across multiple sessions:
| Name | Definition |
|---|---|
| Local sessions | The number of local applications that are current connected to a database within the database manager instance being monitored (local_cons). |
| Remote sessions | The current number of connections initiated from remote clients to the instance of the database manager that is being monitored (rem_cons_in). |
| FCM buffers sent | The total number of FCM buffers that have been sent from the node issuing the GET SNAPSHOT (see –n command line option) to any other node (total_buffers_sent). |
| FCM buffers rec | The total number of FCM buffers received by the node issuing the GET SNAPSHOT command (see –n command line option) from any other node (total_buffers_rcvd) |
| Piped Sorts req | The number of piped sorts that have been requested (piped_sorts_requested). |
| Max Agents | The maxagents configuration parameter is deprecated in Version 9.5, but is still being used by pre-Version 9.5 data servers and clients. Any value specified for this configuration parameter will be ignored by the DB2® Version 9.5 database manager. Prior to Version 9.5, this parameter indicated the maximum number of database manager agents, whether coordinator agents or subagents, available at any given time to accept application requests (maxagents). |
| Sheapthres | The sheapthres configuration parameter is an instance-wide soft limit on the total amount of memory that can be consumed by private sorts at any given time. When the total private sort memory consumption for an instance reaches this limit, the memory allocated for additional incoming private sort requests is considerably reduced. The value reported is that of sheapthres parameter multiplied by the number of partitions in the instance and in units of a multiple of bytes (e.g. KB, MB, GB, etc.)
sheapthres × num_nodes_in_db2_instance × 4096 |
| Dynamic SQL stmts | The number of dynamic SQL statements that were attempted (dynamic_sql_stmts). |
| Bufferpool reads |
sum(pool_data_l_reads + pool_index_l_reads + pool_temp_data_l_reads + pool_temp_index_l_reads) where sum() means summing across all sessions. |
Beneath the set of gauges are two columns of aggregated session data. The first column:
| Name | Definition |
|---|---|
| Agents stolen | The number of idle agents associated with an application which get reassigned to work on a different application (agents_stolen). |
| Max Sort Heap | The private sort memory high watermark, in some mulitple of bytes (e.g. KB, MB, etc.), across the database manager(sort_heap_top × 4096). Shown in bold when the sort_heap_top exceeds sheapthres. |
| Static SQL stmts | The number of static SQL statements that were attempted (static_sql_stmts). |
| Bufferpool writes |
sum(pool_data_writes + pool_index_writes) where sum() means summing across all sessions. |
The second column:
| Name | Definition |
|---|---|
| Agent overflows | The number of times a request to create a new agent was received when the Maximum Number of Agents (maxagents) configuration parameter had already been reached (max_agent_overflows). |
| Sort heap alloc | The total number of allocated pages of sort heap space for all sorts at the database since the last snapshot reset (sort_heap_allocated × 4096).
Shown in bold when sort_heap_allocated is greater than the sheapthres. |
| Post hash joins | The total number of times that a hash join heap request was limited due to concurrent use of shared or private sort heap space (post_threshold_hash_joins). |
| Direct reads |
|
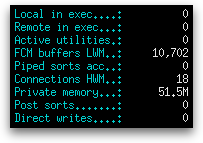
Finally, to the right of the set of gauges is a column containing the following aggregated session data:
| Name | Definition |
|---|---|
| Local in exec | The number of local applications that are currently connected to a database within the database manager instance being monitored and are currently processing a unit of work (local_cons_in_exec). |
| Remote in exec | The number of remote applications that are currently connected to a database and are currently processing a unit of work within the database manager instance being monitored (rem_cons_in_exec). |
| Active utilities | The number of utilities running in the instance. Printed in reverse text if there is a utility running. |
| FCM buffers LWM | The lowest number of free FCM buffers reached during processing (buff_free_bottom). |
| Piped sorts acc | The number of piped sorts that have been accepted (piped_sorts_accepted). |
| Connections HWM | The maximum number of coordinating agents working at one time (coord_agents_top). |
| Private memory | The amount of private memory that the instance of the database manager has currently committed at the time of the snapshot. The comm_private_mem value returned is only relevant on Windows® operating systems (comm_private_mem). |
| Post sorts | The number of sorts that have requested heaps after the sort heap threshold has been exceeded (post_threshold_sorts). |
| Direct writes | The number of write operations that do not use the buffer pool (direct_writes). |
The Sessions screen is affected by all four special keys: pressing ‘k’ switches between deltas and actuals, pressing ‘i’ switches between showing all sessions and showing only active sessions, holding the Shift key and pressing ‘G’ switches between global and local snapshots, and holding the Shift key and pressing ‘X’ adds even more aggregate data to the columns surrounding the set of gauges, which we will examine in part 3.


