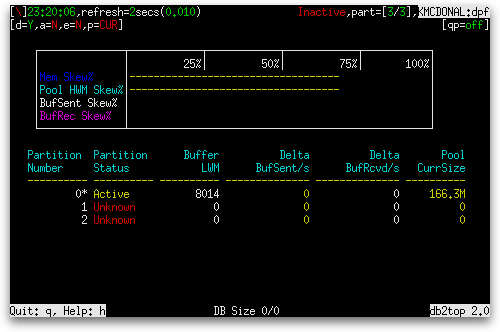
Today’s post is about DB2 Data Partitioning Feature (available in Infosphere Warehouse) and how you can use db2top to monitor your partitions. In this post, you’ll see how to use the Partitions screen to watch for skew between partitions in real-time. The Partitions screen can be launched by pressing the ‘p’ key. It is your typical screen, with a set of gauges up top and a table below, as shown below:

The following four gauges are shown at the top:
| Gauge Name | Gauge Type | Definition |
|---|---|---|
| Mem Skew% | Normal |
A measure of the asymmetry in memory use among partitions. 1 – ((partsum(tbspsum(pool_cur_size)) / node_count) / max(tbspsum(pool_cur_size))), where:
|
| Pool HWM Skew% | Normal | 1 – ((partsum(tbspsum(pool_watermark)) / node_count) / max(tbspsum(pool_watermark))), where:
|
| BufSent Skew% | Normal |
A measure of the asymmetry among partitions in the amount of FCM buffers that have been sent between partitions during the interval. 1 – ((sum(total_buffers_sent) / node_count) / max(total_buffers_sent)), where:
|
| BufRec Skew% | Normal |
A measure of the asymmetry among partitions in the amount of FCM buffers that have been received at each partition during the interval. 1 – ((sum(total_buffers_rcvd) / node_count) / max(total_buffers_rcvd)), where:
|
The following table columns are shown (shown here seven columns at a time):
| Column Name | Definition |
|---|---|
| Partition Number | The number assigned to the node in the db2nodes.cfg file (node_number). |
| Partition Status |
This element indicates the communication connection status between the node issuing the GET SNAPSHOT command and other nodes listed in the db2nodes.cfg file (connection_status). If there are no other nodes, this field is blank. One of the following values can be shown:
If the partition status is anything other than “Active”, the status is shown in red text. |
| Buffer LWM | The lowest number of free FCM buffers reached during processing (buff_free_bottom). |
|
|
|
|
| Pool CurrSize | The aggregate of the current sizes of all memory pools on the partition (sum(pool_cur_size), where sum() means summing across all memory pools). |
| Pool HWM | The sum of the high watermarks of each memory pool on the partition (sum(pool_watermark), where sum() means summing across all memory pools). |
The final seven columns are:
| Column Name | Definition |
|---|---|
| Channels Free | The number of inter-node communication channels that are currently free (ch_free). |
| Space Used | The total number of pages that are currently used (not free) across all table spaces on the partition.
sum(tablespace_used_pages) × tablespace_page_size, where sum() means summing across all table spaces on the partition |
| Total Space | The total number of pages across all table spaces on the partition.
sum(tablespace_total_pages) × tablespace_page_size, where sum() means summing across all table spaces on the partition |
| Log Current | The file number of the active log file the DB2® database system is currently writing (current_active_log). |
| Log First | The file number of the first active log file (first_active_log). |
| Log Last | The file number of the last active log file (last_active_log). |
| Number of Pools | The number of memory pools on the partition. |
The footer tells you your database size.
The screen is affected by pressing the ‘k’ key to switch between showing deltas and actuals and by pressing the ‘G’ key to switch between global and local snapshots.
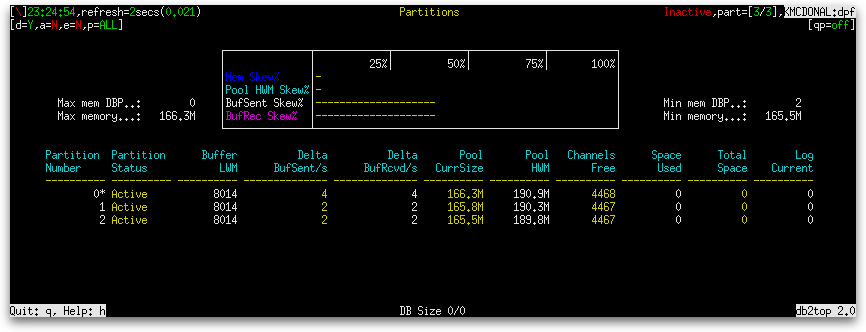
When you increase the width of the screen above 140 columns, a column of aggregates appear on both the left and right of the set of gauges, as shown below:

The aggregates on the left are:
| Aggregate Name | Definition |
|---|---|
| Max mem DBP | The partition with the largest amount of memory in use. |
| Max memory | The largest amount of memory in use on any one partition in the system.
max(sum(pool_cur_size)), where sum() means summing across all memory pools and max() means the maximum found out of all partitions |
The aggregates on the right are:
| Aggregate Name | Definition |
|---|---|
| Min mem DBP | The partition with the smallest amount of memory in use. |
| Min memory | The smallest amount of memory in use on any one partition in the system.
min(sum(pool_cur_size)), where sum() means summing across all memory pools and min() means the minimum found out of all partitions |


