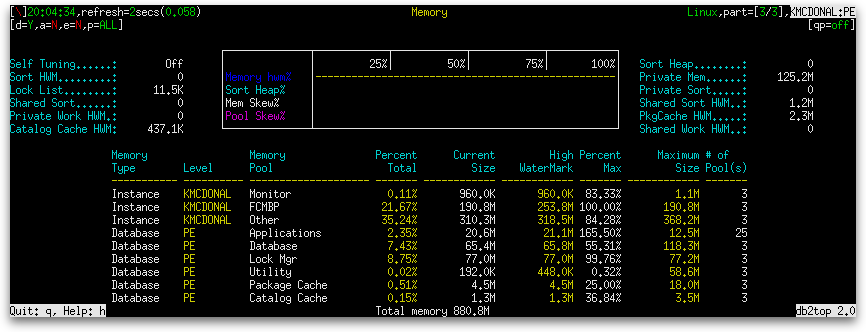
In the first post on the db2top Memory screen, we examined the gauges and table that are visible at all screen sizes. We saw that we could differentiate between the various memory pools on the system and determine how much memory each was consuming in near real-time. We also saw that we could measure the skew of memory pool usage among partitions in systems that use the Data Partitioning Feature. In today’s post, we will examine the aggregates that become available at large screen sizes. We can use these aggregates to see how much memory is being consumed by lock lists, the catalog cache, and sort heap (both shared and private) at both the instance and database levels.
As mentioned in the first post in this series on the db2top Memory screen, when the screen width is increased to 141 columns or wider, a column of names and values appears to the left of the set of gauges and another column of names and values appears to the right, as shown below:

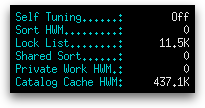
Let’s examine each column of aggregates in turn. The data on the left are:
| Aggregate Name | Definition |
|---|---|
| Self Tuning |
The value of the configuration parameter that determines whether the memory tuner will dynamically distribute available memory resources as required between memory consumers that are enabled for self-tuning (self_tuning_mem). It can have one of the following values:
|
| Sort HWM | The private sort memory high watermark across the database manager (sort_heap_top). Expressed in units that are a multiple of bytes (e.g. KB, MB, etc.). |
| Lock List | The total amount of lock list memory that is in use (lock_list_in_use). Expressed in units that are a multiple of bytes (e.g. KB, MB, etc.). |
| Shared Sort | Total amount of shared sort memory allocated in the database (sort_shrheap_allocated). Expressed in units that are a multiple of bytes (e.g. KB, MB, etc.). |
| Private Work HWM |
The largest size reached by the Private Workspace (priv_workspace_size_top). Expressed in units that are a multiple of bytes (e.g. KB, MB, etc.). Note: This monitor element has been deprecated. Using this monitor element will not generate an error. However, it does not return a valid value. This monitor element is no longer recommended and might be removed in a future release.
|
| Catalog Cache HWM | The largest logical size reached by the catalog cache (cat_cache_size_top). Expressed in units that are a multiple of bytes (e.g. KB, MB, etc.). |
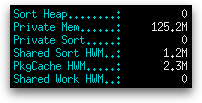
The data on the right are:
| Aggregate Name | Definition |
|---|---|
| Sort Heap | The total number of allocated pages of sort heap space for all sorts at the database manager level and at the time the snapshot was taken (sort_heap_allocated). Expressed in units that are a multiple of bytes (e.g. KB, MB, etc.). |
| Private Mem | The amount of private memory that the instance of the database manager has currently committed at the time of the snapshot (comm_private_mem). The comm_private_mem value returned is only relevant on Windows® operating systems. |
| Private Sort | The total number of allocated pages of sort heap space for all sorts at the database level and at the time the snapshot was taken (sort_heap_allocated). Expressed in units that are a multiple of bytes (e.g. KB, MB, etc.). |
| Shared Sort HWM | Database-wide shared sort memory high watermark(sort_shrheap_top). Expressed in units that are a multiple of bytes (e.g. KB, MB, etc.). |
| PkgCache HWM |
The largest size reached by the package cache (pkg_cache_size_top). Expressed in units that are a multiple of bytes (e.g. KB, MB, etc.). Note: The pkg_cache_size_top monitor element is deprecated starting with DB2® Version 9.5. Using this monitor element will not generate an error. However, it does not return a valid value. This monitor element is no longer recommended and might be removed in a future release.
|
| Shared Work HWM |
The largest size reached by shared workspaces (shr_workspace_size_top). Expressed in units that are a multiple of bytes (e.g. KB, MB, etc.). Note: This monitor element has been deprecated. Using this monitor element will not generate an error. However, it does not return a valid value. This monitor element is no longer recommended and might be removed in a future release.
|
The footer displays the total memory for the instance as a whole.
The Memory screen is affected by holding the Shift key and pressing the ‘G’ to switch between global and local snapshots. It is not affected by pressing the ‘k’ to switch between deltas and actuals, pressing the ‘i’ key to switch between active objects and all objects, or holding the Shift key and pressing the ‘X’ key to turn extended mode on and off.


