Today’s db2top screen is a very useful one for tracking down locking problems. You can use it to find lock waiters, lock holders and follow the chain from waiter to holder to diagnose the source of your long lock wait times.
You launch the Lock screen by holding the shift key and pressing the ‘U’ key. First, I’ll create a lock holder and a waiter. I will open two terminals, start the DB2 Command Line Processor (CLP) in each, connect to a database named ‘dpf’ and turn off auto-commit:
/home/kmcdonal> db2
(c) Copyright IBM Corporation 1993,2007

Command Line Processor for DB2 Client 9.7.1
...
db2 => connect to dpf
Database Connection Information
Database server        = DB2/LINUXX8664 9.7.1

SQL authorization ID   = KMCDONAL

Local database alias   = DPF
db2 => update command options using c off

DB20000I  The UPDATE COMMAND OPTIONS command completed successfully.
From terminal 1, I will create a lock holder by creating a table and not committing it:
db2 => create table t1 (i1 integer)

DB20000I  The SQL command completed successfully.
From terminal 2, I will create a lock waiter by selecting from the uncommitted table:
db2 => select * from t1
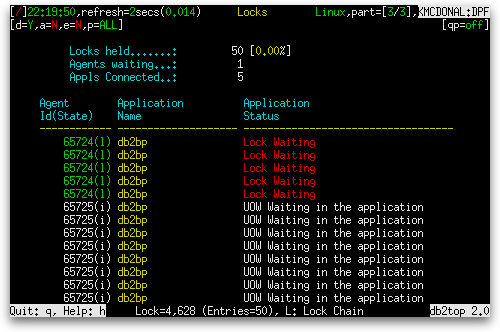
Returning to the Locks screen, we see several entries for an application in “Lock Waiting” state and several more for an application in “UOW Waiting in the application” state, as shown below:

Looking at the Locks screen, we see that it is made up of a column of three aggregates at the top and a table below. The aggregates are:
| Name | Definition |
|---|---|
| Locks held | The number of locks currently held (locks_held) and, in brackets, the percentage of lock list storage consumed by held locks (locks_held / (locklist × 4096)). |
| Agents waiting | The number of agents waiting on a lock (locks_waiting). |
| Appls Connected | The number of applications that are currently connected to the database (appls_cur_cons). |
The table is made up of the following columns, shown one screen at a time:
| Column Name | Definition |
|---|---|
| Agent Id(State) | A system-wide unique ID for the application (agent_id), together with a short code for the current status of the application (appl_status) in parentheses. Possible values for the status are:
|
| Application Name | The name of the application running at the client, as known to the database or DB2® Connect™ server (appl_name), truncated to 20 characters. |
| Application Status | The current status of the application (appl_status). Shown in yellow if the application is active. Shown in red if the application is waiting on a lock. Possible values are:
|
| Column Name | Definition |
|---|---|
| Object Name | The type of object against which the application holds a lock (lock_object_type). If the lock is on a table, it reports table_schema . table_name for non-DPF systems and table_schema . table_name [data_partition_id] for DPF systems, both of which are truncated to 40 characters if necessary. Otherwise, it can have one of the following possible values:
|
| Lock Mode |
If requesting a lock, the lock requested and the lock held are both shown (lock_mode_requested[lock_mode]). Otherwise, just the lock held is shown (lock_mode). The lock requested and the lock held can each take on one of the following values:
|
| Object Type | The type of object against which the application holds a lock (lock_object_type), expressed in short form with the following possible values:
|
| Column Name | Definition |
|---|---|
| Lock Status |
The internal status of the lock (lock_status). It is shown as one of the following values:
|
| Lock Count | The number of locks on the lock being held (lock_count). When a value of 255 is reported, this indicates that a transaction duration lock is being held. If no locks are being held, a “-” is reported. |
| Is Blocker | It shows “Yes” in cyan if this application is holding a lock upon which another application is waiting. Otherwise, it shows “No”. |
| Locked By | If locked by another application, this reports the application handle of the agent holding a lock for which this application is waiting (agent_id_holding_lock). Otherwise, “-” is shown. |
| Tablespace Name | The name of the table space against which the application currently holds a lock (tablespace_name). |
The footer at the bottom of the screen shows additional aggregate information:
| Aggregate Name | Definition |
|---|---|
| Lock= | The number of lock holders measured across all locks on the database (sum(lock_count), where sum() is the sum across all applications and locks). |
| Entries= | The number of locks held across all applications on the database (sum(locks_held), where sum() is the sum across all applications). |
The footer also indicates how to invoke the Lock Chain screen.
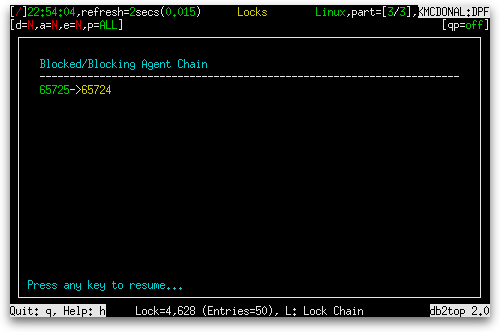
As indicated in the footer, you can launch the Lock Chain screen by holding down the shift key and pressing the ‘L’ key. The Lock Chain screen looks like the following:

Here we see that application 65724 is waiting on a lock held by application 65725.

