The db2top tool supports an extended mode in which it shows different information than it shows in the default mode. Today, we will see how the -x command line option can put you into extended mode and how that affects what information db2top displays.
You can switch between the regular and extended modes interactively, but if you want to start db2top in the extended mode or you want to use the extended mode when running db2top non-interactively, you can specify the -x option on the command line. The -x option takes no arguments. The screens affected by the extended mode include the Agent screen, the Sessions screen, and the Utilities screen.
The Agent Screen
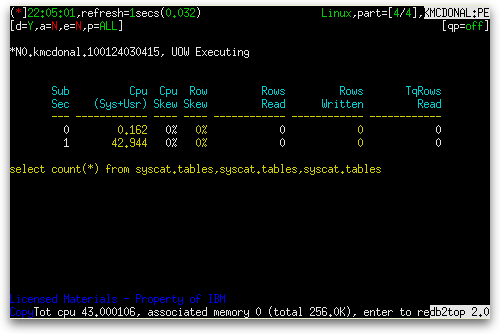
The Agent screen, when run against a database that uses the Data Partitioning Feature (DPF), can show the subsections of an executing statement. When the extended mode is turned off (indicated by the e=N in the second row of status indicators at the top left of the screen), columns 3 and 4 are Cpu Skew and Row Skew, respectively, as in the screen below:
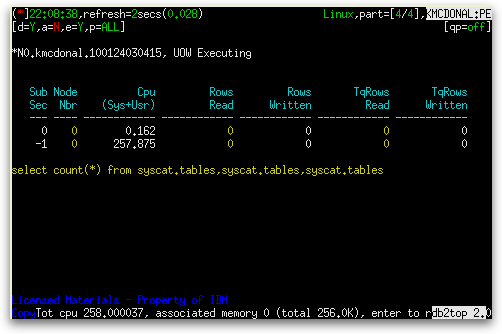
When run in extended mode (indicated by e=Y), these two columns disappear and instead we see a Node Nbr column inserted before the Cpu (Sys+Usr) column, as shown below:
The Sessions Screen
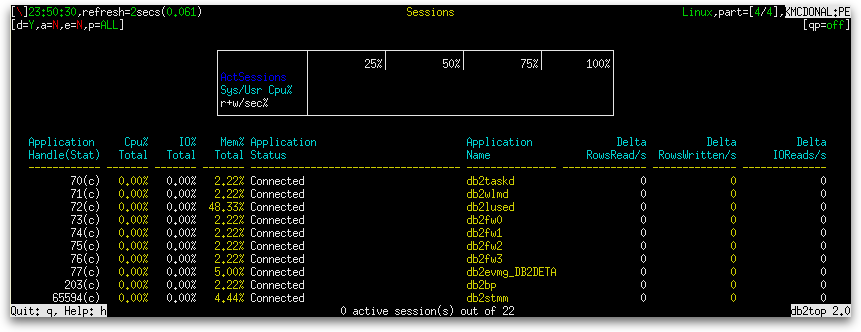
The Sessions screen for a normal screen size of 80 columns by 24 rows shows a set of gauges and a table of sessions and continues to show this for screens that are as wide as 139 columns, as shown below:
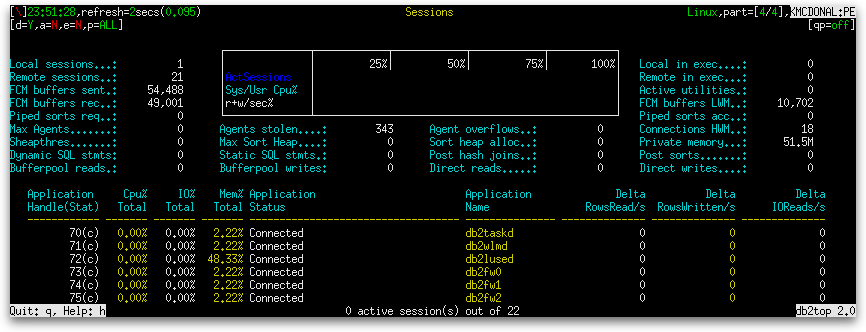
When you increase the width to 140 columns, however, the Sessions screen now adds several aggregates surrounding the set of gauges, as shown below:
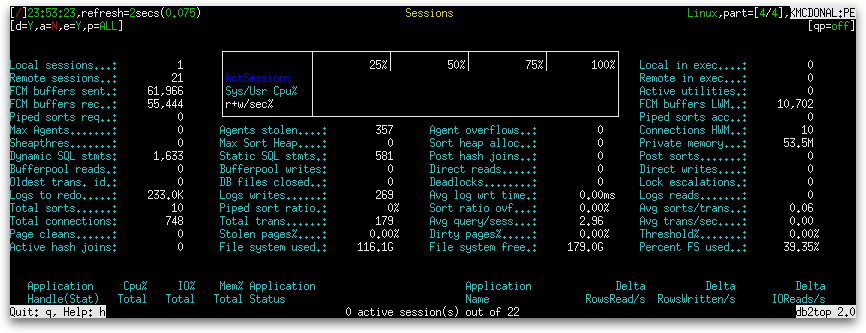
When you turn on extended mode, even more aggregates are shown, as shown below:
The Utilities screen
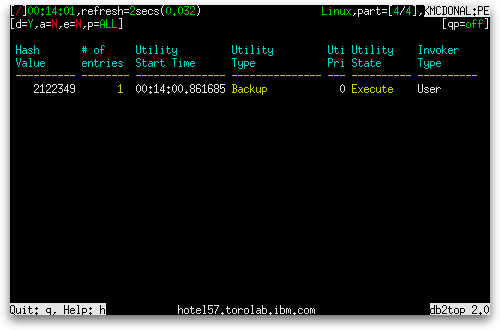
The Utilities screen can show a utility, such as a backup, executing against the database. When extended mode is off, column 2 is labeled “# of entries”, as shown below:
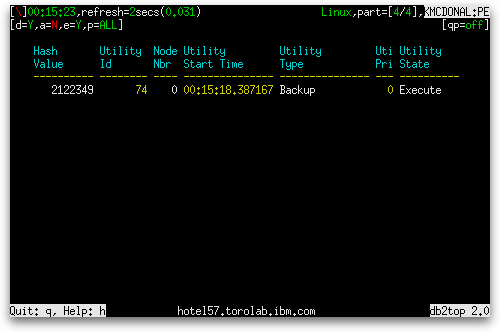
When extended mode is turned on, column 2 becomes “Utility Id” and new column, “Node Nbr”, is inserted before the “Utility Start Time” column, as shown below:
