Considering the dramatic differences in speed between memory access and disk access, it is not surprising that DB2’s own documentation claims that configuring buffer pools is the single most important tuning area for DB2. In most cases, using more than one buffer pool on your system can have performance advantages. For example:
- Breaking out temporary table spaces into their own buffer pools lets you provide better performance for those queries that use them (e.g. heavy users of sorts).
- Breaking out short update-transactions into their own appropriately-sized buffer pool can lower response times.
- Separating read-heavy applications from write-heavy applications using buffer pools can reduce the impact one set of applications has on the other.
- Using small buffer pools for seldom accessed data frees up memory for other applications.
In today’s post, you will see what information db2top provides to help you to make better decisions about how many buffer pools you need and how big they each need to be. We will examine how db2top lets you track database-wide hit ratios for your buffer pools, even separating them out into data, index, and temp hit ratios, and see whether your buffer pools are performing mostly reads versus writes or mostly data accesses versus index accesses or temp accesses.
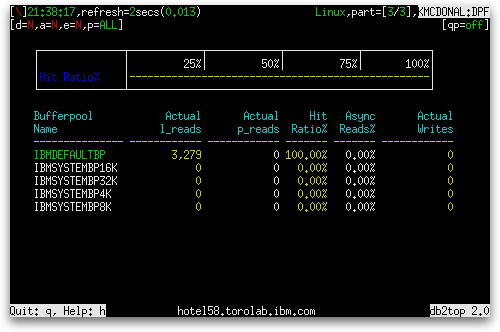
You launch the bufferpools screen by pressing the ‘b’ key. This screen consists of the usual combination of a gauge at the top and a table when the width of the screen is between 80 and 140 columns, as shown below:

The single gauge is for Hit Ratio% across all buffer pools.
| Gauge Name | Gauge Type | Definition |
|---|---|---|
| Hit Ratio | Normal | The percentage of requests for pages (data or index) from buffer pools, measured across all buffer pools, that were serviced without requiring a physical read from a table space container.
(1 – sum(pool_data_p_reads + pool_index_p_reads + pool_temp_data_p_reads + pool_temp_index_p_reads) / sum(pool_data_l_reads + pool_index_l_reads + pool_temp_data_l_reads + pool_temp_index_l_reads)) × 100%, where sum() means measuring across all buffer pools |
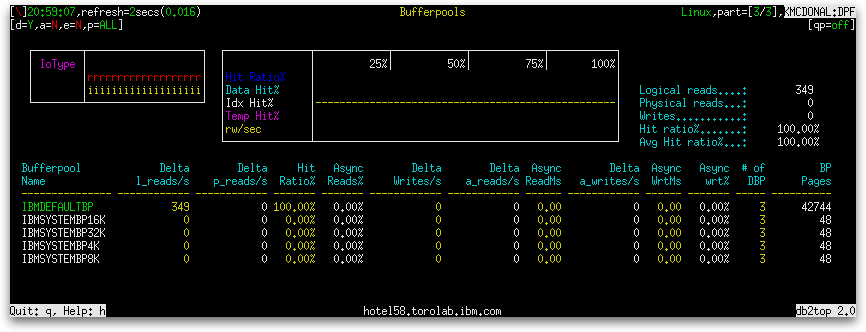
When the screen width exceeds 140 columns, the screen changes to show more information, as shown below:

The set of gauges in the center of the gauge area of the screen includes the following gauges:
| Gauge Name | Gauge Type | Definition |
|---|---|---|
| Data Hit% | Normal | The percentage of requests for data pages from buffer pools, measured across all buffer pools, that were serviced without the need for a physical read from a table space container.
(1 – sum(pool_data_p_reads) / sum(pool_data_l_reads)) × 100%, where sum() means measuring across all buffer pools |
| Idx Hit% | Normal | The percentage of requests for index pages from buffer pools, measured across all buffer pools, that were serviced without the need for a physical read from a table space container.
(1 – sum(pool_index_p_reads) / sum(pool_index_l_reads)) × 100%, where sum() means measuring across all buffer pools |
| Temp Hit% | Normal | The percentage of requests for temporary data and temporary index pages from buffer pools, measured across all buffer pools, that were serviced without the need for a physical read from a table space container.
(1 – sum(pool_temp_data_p_reads + pool_temp_index_p_reads) / sum(pool_temp_data_l_reads + pool_temp_index_l_reads)) × 100%, where sum() means measuring across all buffer pools |
| rw/sec | Average Seconds |
where:
|
A second gauge block appears to the left of the main block of gauges and a list of aggregates appears to the right. The only gauge on the left is labeled IoType.
| Gauge Name | Gauge Type | Definition |
|---|---|---|
| IoType | IO Breakdown |
The first line of the gauge presents two pieces of data:
The second line presents three pieces of data:
The length of each sequence of the same character is proportional to how much of the total I/O that the particular I/O subtype (reads, writes, data, index, or temp) contributes. |
On the right of the main gauge, a single column of aggregates appears:
| Name | Definition |
|---|---|
| Logical reads |
|
| Physical reads |
|
| Writes |
|
| Hit ratio% | The percentage of requests for pages (data or index) from buffer pools, measured across all buffer pools, that were serviced during the last interval without requiring a physical read from a table space container.
(1 – sum(pool_data_p_reads + pool_index_p_reads + pool_temp_data_p_reads + pool_temp_index_p_reads) / sum(pool_data_l_reads + pool_index_l_reads + pool_temp_data_l_reads + pool_temp_index_l_reads)) × 100%, where sum() means measuring across all buffer pools |
| Avg Hit Ratio% | Similar to Hit ratio% above but weighting all buffer pool hit ratios equally. For example, if buffer pool BP1 had 1 hit in 10 requests and buffer pool BP2 had 89 hits in 90 requests, the Hit ratio% would be (1 + 89) / (10 + 90) = 90% and the Avg Hit Ratio% would be (1/10 + 89/90) / 2 = 54%. |
In part 2, we will examine the data reported in the table below the gauges and aggregates.


