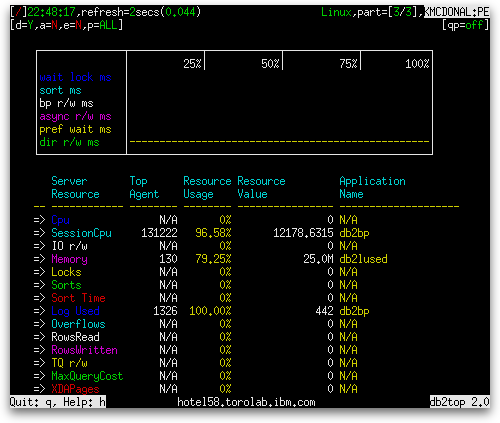
The db2top Bottlenecks screen lets us see who the biggest consumers of each resource are and how much of the resource they are consuming. These top consumers can often cause such resources to become bottlenecked, so the Bottlenecks screen gives you an easy way to find the cause of such bottlenecks so that you can take action. Today, we will examine each of the individual resources for which the bottleneck screen reports the biggest consumer and how much it consumes.
While the minimum size of the db2top screen is 24 rows in height, not all resources can be accommodated at this height. A screen of 31 rows or taller fits all resource types, as shown below:

The following table lists the resources and percentage and absolute usage along with the calculation that is performed to determine how much of the resource is being consumed:
| Server Resource | Resource Usage | Resource Value | Calculation |
|---|---|---|---|
| Cpu |
|
|
|
| SessionCpu | The percentage of total session CPU consumption that is caused by the application that is consuming the most CPU. | The session CPU consumption of the application that is consuming the most CPU. | agent_usr_cpu_time + agent_sys_cpu_time |
| IO r/w |
|
|
pool_data_l_reads + pool_index_l_reads + pool_temp_data_l_reads + pool_temp_index_l_reads + pool_data_writes + pool_index_writes |
| Memory | The percentage of total memory caused by the application that is consuming the most memory. | The memory consumption of the application that is consuming the most memory. | pool_cur_size |
| Locks | The percentage of the total number of locks held by all applications that are held by the application that is holding the most locks. | The number of locks held by the application that is holding the most locks. | locks_held |
| Sorts | Currently reports incorrect data. APAR number forthcoming. | Currently reports incorrect data. APAR number forthcoming. | |
| Sort Time | The percentage of the total time spent sorting by all applications that was spent by the application that is spending the most time sorting. | The time spent sorting by the application that is spending the most time sorting. | total_sort_time |
| Log Used | Of the total amount of log space used in the current units of work of all applications, the percentage used by the application that is using the most log space. | The amount of log space used in the current unit of work of the application that is using the most log space. | uow_log_space_used |
| Overflows | The percentage of the total number of sort and hash join overflows caused by the application that has had the most sort and hash join overflows. | The number of sort and hash join overflows of the application that has had the most sort and hash join overflows. | sort_overflows + hash_join_overflows |
| RowsRead |
|
|
rows_read |
| RowsWritten |
|
|
rows_written |
| TQ r/w |
|
|
tq_rows_written + tq_rows_read |
| MaxQueryCost | Of the sum of all the maximum estimated query costs of all applications, the percentage that came from the maximum estimate query cost of the application that had the highest maximum estimated query cost. | The maximum estimated query cost of the application that had the highest maximum estimated query cost of all applications. | max(query_cost_estimate), where max() computes the maximum for the application |
| XDAPages |
|
|
xda_object_pages |
The Bottlenecks screen responds to the ‘k’ key to switch between deltas and actuals. It is not affected by the ‘i’ key to switch between showing active objects and all objects and it is not affected by the ‘X’ key to turn extended mode on and off.
For other articles on db2top at this site, see the main db2top page.
