In part 2 of this series on the db2top Agent screen, you will see just how much more detailed the Agent screen becomes on DB2 systems that have the Data Partitioning Feature (DPF). Not only can you see the individual subsections of an executing statement, but also how they are processed at each partition. You also see the information rolled up to the subsection level, the statement level, and all the way up to the application itself. The subsection level information helps you to diagnose problems of skew between partitions, while the higher level aggregates help you identify problems of low sort heap allocation at the application level or heavy sort heap usage at the individual statement level.
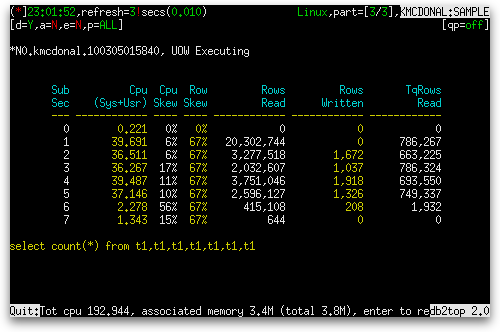
When using the Data Partitioning Feature, the Agent screen has a different appearance than its non-DPF form. By default, for screens between 80 and 140 columns wide, the Agent screen looks like the following:

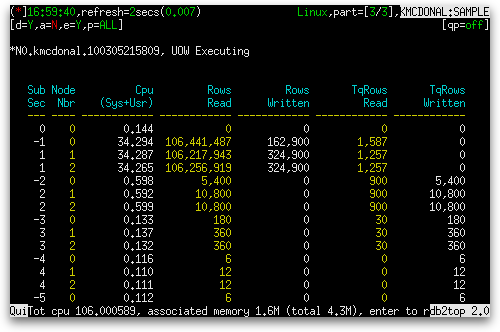
At the top left of the screen below the header we see the application ID followed by the state of the application. Beneath that is a table of subsection information. If we hold the Shift key and press the ‘X’ key to enter extended mode, a new column named “Node Nbr” is added after “Sub Sec”, the columns “Cpu Skew” and “Row Skew” are removed, and each subsection’s data is split across the nodes it runs on instead of being aggregated as in the non-extended mode. So, in a three partition system, we see three times as many rows in the table in extended mode for subsections numbered above zero, as shown below:

The table consists of the following columns:
| Column Name | Definition |
|---|---|
| Sub Sec | A number identifying the subsection (ss_number). |
| Node Nbr1 | Node where the subsection was executed (ss_node_number). |
| Cpu (Sys+Usr) |
|
| Cpu Skew2 | A measure of asymmetry in the distribution of CPU time among partitions when executing the subsection.
1 – ((sum(ss_sys_cpu_time + ss_usr_cpu_time)/node_count) / max(ss_sys_cpu_time + ss_usr_cpu_time) where sum() is the sum across all partitions, max() is the maximum across all partitions, and node_count is the number of nodes executing subsections. |
| Row Skew2 | A measure of asymmetry in the distribution of the reading and writing of data among partitions when executing the subsection.
1 – ((sum(rows_read + rows_written)/node_count) / max(rows_read + rows_written) where sum() is the sum across all partitions, max() is the maximum across all partitions, and node_count is the number of partitions executing subsections. |
| Rows Read | |
| Rows Written |
|
| TqRows Read |
|
| TqRows Written |
|
| Tq Spills |
|
| Memory |
|
| Exec Time |
|
| # of DBP | Number of database partitions executing the subsection. |
| Ag. |
|
| SubSection Status |
The status codes are:
|
| Waiting TQueue(s) |
|
1 Shown in extended mode only
2 Shown in regular mode only
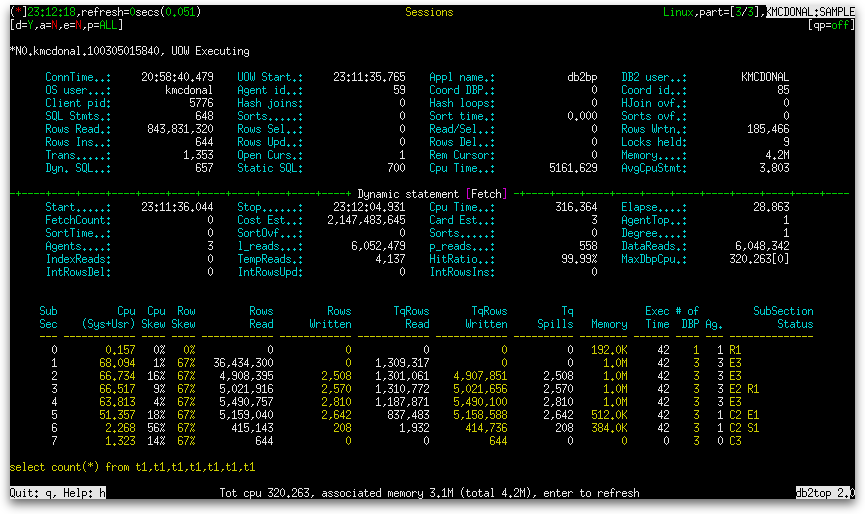
The table does not scroll, so the 80 column wide screen hides several columns. When the width of the screen exceeds 140 columns, the screen changes dramatically:

However, the screen width needs to be increased to at least 143 columns to include the final table column “Waiting TQueue(s)”. The aggregates shown in the top half of the screen are split into columns based on how wide the screen is. If you hold the Shift key and press the ‘M’ key, the aggregates are hidden and only the subsection table is shown. In the final post in this series on the Agent screen, we will examine each of these aggregates.

